General configuration (Chart tab)
The Chart tab lets you define properties, general execution properties, and the appearance of the chart area:
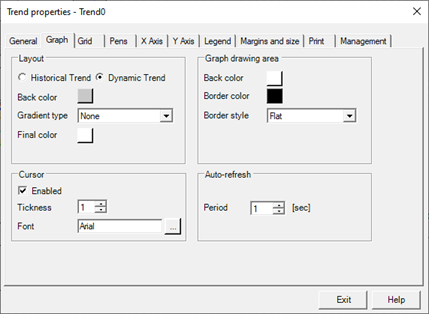
The configuration fields of the Graph tab are:
|
Visualization |
|
|
Historical Trend Dynamic Trend |
Select the animation type. (See. "Trend type") |
|
Background Color |
Specifies the background color of the graph. |
|
Color Chart Area |
Specifies the color of the background area of the trend display. |
|
board |
Specifies the border style of the trend. You can select one of the following values:
|
|
Cursor |
|
|
Enable |
If selected, enables the cursor function, which allows you to query the value of the points of the trend displayed. For more information on this feature see section Cursor function later in this chapter |
|
Thickness |
Specify the thickness of the line cursor |
|
Character |
Press the [...] button to configure the font used for displaying values. |
|
Grid |
|
|
Horizontal |
Shows/hides the horizontal grid lines. |
|
Vertical |
Shows/hides the vertical lines of the grid. |
|
Style |
It allows access to the Line Style dialog, where you can select the style of the grid lines. For more information see the lines Style |
|
Auto Update |
|
|
Period |
Specifies the value in seconds of the period of self-refreshing of the graph (Dynamic Trend only) |
|
Enable configugraphic ration running |
If selected, enables the display and modification of the properties of the graph by the user at runtime. |