Pens configuration (Pens tab)
Each Trend object (historical or dynamic) allows you to simultaneously view a maximum of 16 trends.
Note: The sixteen displayed values must belong to the same sampling group
Each trend is identified by the pen with which it is drawn.
The term Pen refers to a displayed measure, scale, line format, label format ...
The Pens tab, shown in the figure, allows you to define the sampling group linked to the trend and to configure the pens, i.e. the trends drawn:
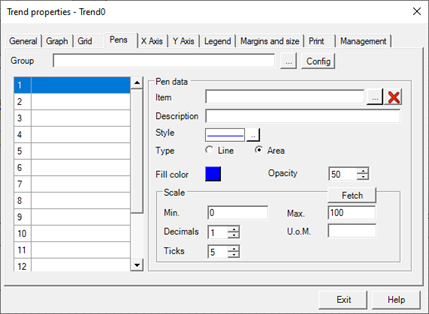
The sixteen assignable pens are displayed in the list on the left; by selecting a pen, the Pen Data group displays the related configuration data and allows its editing.
Selecting the sampling group
Each Trend must be associated with a Sampling Group among those defined in the DataLogger configuration.
The sampling groups whose configuration is compatible with this use can be associated to a trend: see the chapter "Configuration of sampling groups linked to Trend".
The Sample group field on the Pens tab allows you to specify the sample group associated with the current trend.
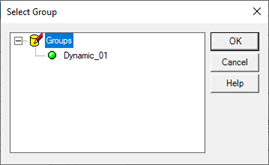
The "..." button relative to the field allows you to select the group from a list of associable groups:
Trends configuration
To configure the pens, simply select the pen you want to configure in the list on the left, then use the fields in the Pen Data frame:
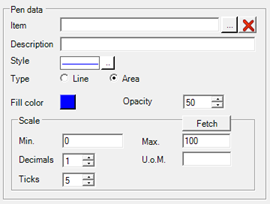
The configurable parameters are:
|
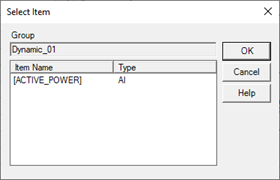
item |
Select the item associated with the pen, among those sampled in the specified Sampling Group.
|
|
Description |
Specifies the description of the current pen. The description appears in the left list and will be visible in the legend at run-time. The entry is optional. |
|
Style |
It allows access to the Line Style dialog, where you can select the style of the grid lines. For more information see "Style of the trend lines." |
|
Guy |
Specifies whether the trend should be plotted in the form of line or area. In the second case, the space between the line of the trend and the axes is filled with the specified color. |
|
Filling |
Specifies the fill color of the plotted if graph type is set to "Area" |
|
Scale |
|
|
Fetch |
Retrieves the Minimum, Maximum, and Unit of Measure from the item data. |
|
Minimum |
Specifies the minimum value of the scale |
|
Maximum |
Specifies the maximum value of the scale |
|
Ticks |
It indicates the number of Ticks on the scale |
|
Unit |
Specifies the unit of measurement of the sampled measure. This information is displayed in the legend. The entry is optional. |
|
Label Format |
|
|
Decimal |
Specifies the number of decimal places (to the right of the decimal point) in the value label |
Grid line style
The line style is defined by pressing the Style field button.
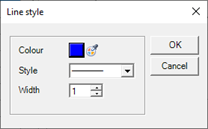
The Line Style dialog has the following fields
|
Color |
Specifies the line color. The button displays the current color and allows editing. |
|
Style |
It defines the line style, allowing you to choose between several types of hatching. |
|
Thickness |
Specifies the line thickness in points. |