Horizontal axis configuration (X Axis tab)
The horizontal axis (X axis) is the axis of the times; the time coordinates of the sampled data are displayed on it.
You can configure the properties of the X axis, such as time scale properties and axis graph format, in the X Axis tab:
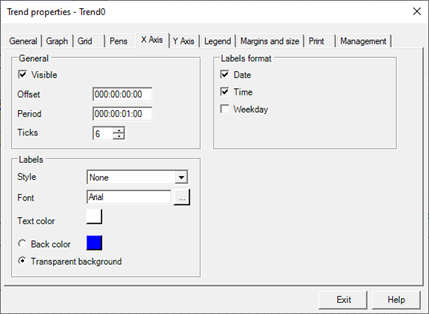
The X Axis tab contains the following configuration fields:
|
General data |
|
|
Offset |
Field available exclusively for historical trends. |
|
Period (timespan) |
Specifies the extent of the chart time window, indicating the amount of time that the view embraces. |
|
Ticks |
Specifies the number of ticks that must be represented on the axis. The number of ticks can not be less than 2. |
|
Labels |
|
|
Style |
Specifies the border style of labels. You can select one of the following formats:
|
|
Font |
The "..." button to configure the font used for the labels. |
|
Text Color |
Specifies the foreground color of the labels. The button displays the current color and allows editing. |
|
Back color |
If selected, specifies the background color of the label. The button displays the current color and allows editing |
|
Transparent background |
If checked, ignores the background color setting and makes the labels transparent. |
|
|
|
|
Labels Format |
|
|
Date |
If selected, enables the display of the date in the labels. |
|
Time |
If selected, enables time display on labels |
|
Day of the week |
If selected, enables the display of the abbreviated day of the week (Mon, Tue, etc.) in the labels. |