Vertical axis configuration (Y Axis tab)
The vertical axis (Y axis) shows the scales of the monitored measurements. The scale can be set differently for each measurement: during run-time, by selecting a measure in the legend, the Y axis shows the scale defined for that measure.
You can configure the graphic format of the Y axis in the Y Axis tab:
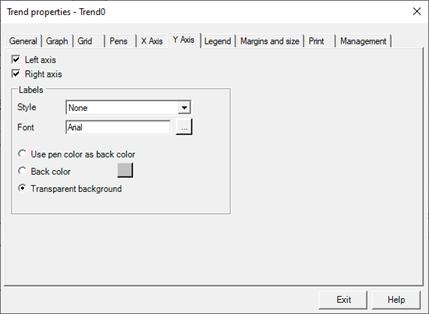
The Y axis tab contains the following configuration fields:
|
Left axis |
If selected, enables display of the axis with labels on the left side. |
|
Right axis |
If selected, enables display of the axis with labels on the right side. |
|
Labels |
|
|
Style |
Specifies the border style of their labels. You can select one of the following formats:
|
|
Font |
The "..." button allows you to configure the font used for the label text. |
|
Use pen color as back color |
By selecting this option the labels are drawn using the color of the pen they refer to as background color. |
|
Back color |
By selecting this option you can define a background color for the labels independent of the pen they refer to. In this case the color of the pen is taken as the foreground color. |
|
Transparent background |
If checked, ignores the background color setting and makes the labels transparent. |